Debugging
Software developers spend a lot of time debugging applications. The time spent often times is more than developing or adding a new feature. This reduces the productivity of software developers.
In this section two debugging approaches for the operator services will be introduced, Debugging with VS Code and Debugging with Delve. The former approach is useful for developers who uses Visual Studio Code as their main IDE, meanwhile the latter approach is suitable for server debugging with command lines for experienced Linux user.
Debugging with Visual Studio Code
- Open Visual Studio Code and open the project folder.
-
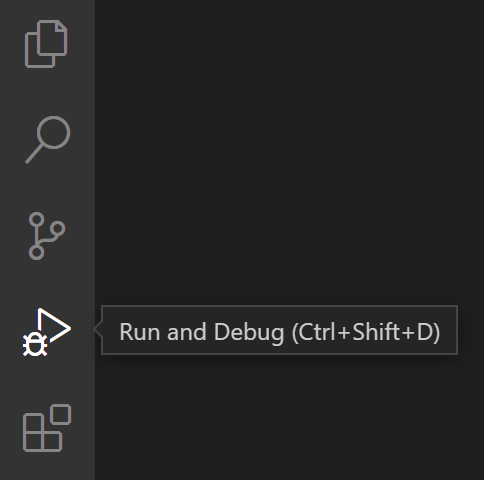
Select Run and Debug in the activity bar.
-
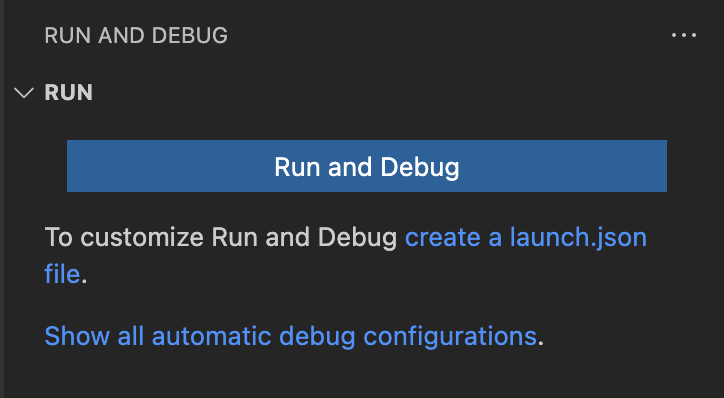
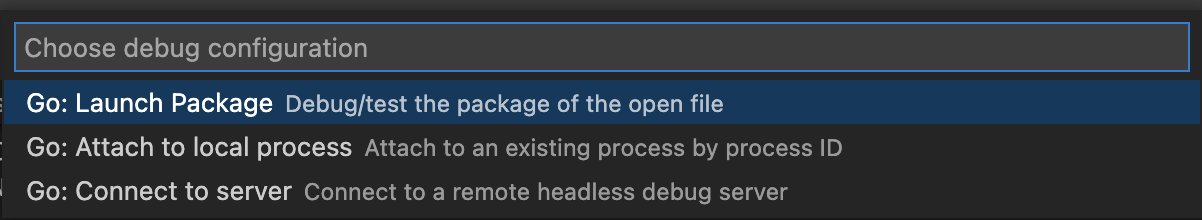
If
launch.json is not yet configured, click create a launch.json file and select Go: Launch Package.
- Open the generated file in
.vscode/launch.json. Change the program value to cmd.
- Add
env object field and fill it with the required environment variables.
- Your launch.json should now look like this:
{
      "version": "0.2.0",
      "configurations": [
          {
              "name": "Launch Package",
              "type": "go",
              "request": "launch",
              "mode": "auto",
              "program": "cmd",
              "env": {
                  "PORT": "8080",
                  "OPERATOR_CODE": "dev",
                  "GOOGLE_PROJECT_ID":"provider-serverless"
              }
          }
      ]
- To start debugging, press F5 or click the
Start Debugging button.
Follow the instructions in Visual Studio Code Documentation on Debugging for further debugging guide.
Debugging with Delve Debugger
Follow the instructions in Delve Github Repository